Cisco Meraki Monitoring with FrameFlow
Cisco Meraki is a centralized, cloud-based tool that aggregates and manages Meraki devices, all in one place. FrameFlow's Meraki-compatible event monitors update information and send alerts about bandwidth and interface statistics. We've even got an event monitor that automatically detects devices in your Meraki account and adds them to your monitoring configuration. This blog post will show you a bit about each event monitor.
 Cisco Meraki Logo
Meraki Discovery
To create a fresh Meraki Discovery Event Monitor, all you need to input is the Meraki API key and the organization name you want to import Meraki managed switch (MS) devices, routers, and wireless devices from. The rest of the settings work the same as our other discovery event monitors: just select the device group where you want to add onboarded devices, add filtering options that can prevent previously discovered devices from getting in the way, and you're set.
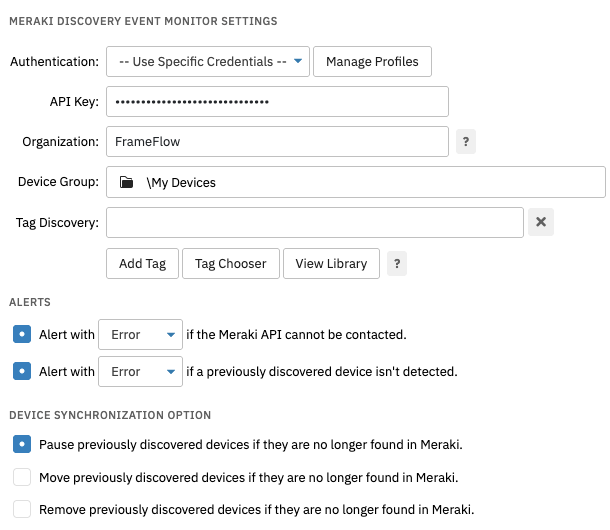 Discovery Settings
Custom Settings Sections for Meraki Devices
Once you've run the Meraki Discovery Event Monitor and discovered new devices, you can view them in the Network Devices section of FrameFlow. Meraki devices that are added to your configuration are automatically given invisible inventory tags that help you sort and manage hundreds or even thousands of devices. In the custom settings section for Meraki devices, you can view the following additional fields: Serial Number, Device Type, Last Contact, Status, and Hardware Model. These fields are specific to your Meraki devices and are automatically populated when the device gets onboarded.
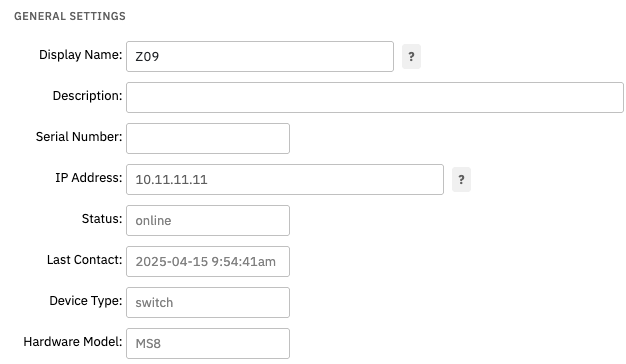 Meraki Device Settings Tab
Meraki Bandwidth Event Monitor
FrameFlow's Meraki Bandwidth Event Monitor also uses API calls to connect to your Cisco Meraki devices. This event monitor works similarly to our other bandwidth monitors, but has specialized settings for Meraki. Due to throttling from Cisco, it's common for this monitor to take about fifteen minutes to run for larger organizations with thousands of Meraki devices. You can receive separate alerts about incoming, outgoing, and total bandwidth rates.
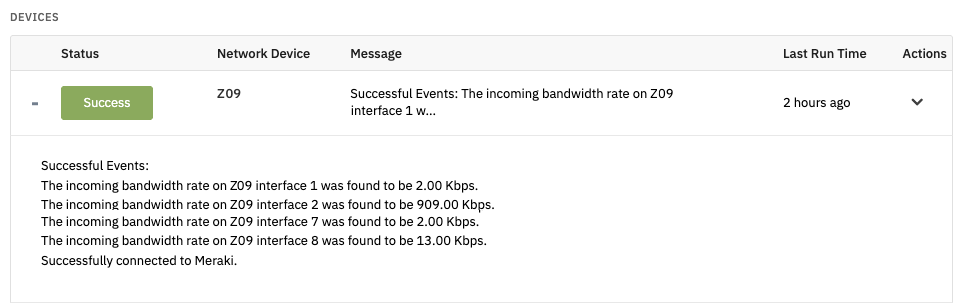 Meraki Bandwidth Event Monitor Output
Note: Meraki Bandwidth Event Monitors are compatible with the managed switch (MS) device type only.
Data gathered by your Meraki Bandwidth Event Monitor can also be added to Meraki devices as a graph for easy access. To do so, go to the Status tab of your desired Meraki device. You can add a status graph to any device with a Meraki Bandwidth monitor connected in the device's "Status Graphs" section.
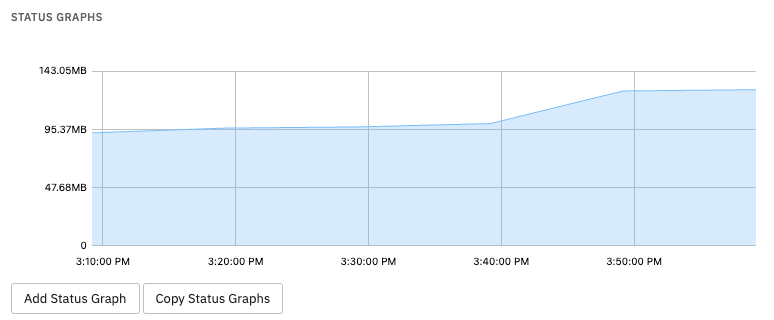 Bandwidth Graph on a Meraki Device
Meraki Interface Event Monitor
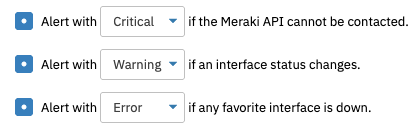
Finally, our Meraki Interface Event Monitor connects to your Meraki devices and sends alerts about three important interface metrics. This event monitor will alert you if it cannot connect to the Meraki device being monitored, if any interface marked "Favorite" is down, and if the status for any connected device changes. The level of FrameFlow alert you receive in each of these cases is completely customizable.
 Meraki Interface Settings
Just like our other interface event monitors, all connected devices will get an extra "Interfaces" tab where you can view Meraki-specific interface information about them. From the Interfaces tab, you can mark individual interfaces as "Favorite" or ignore them. This event monitor also works with the managed switch device type exclusively.
 Meraki Interface Data
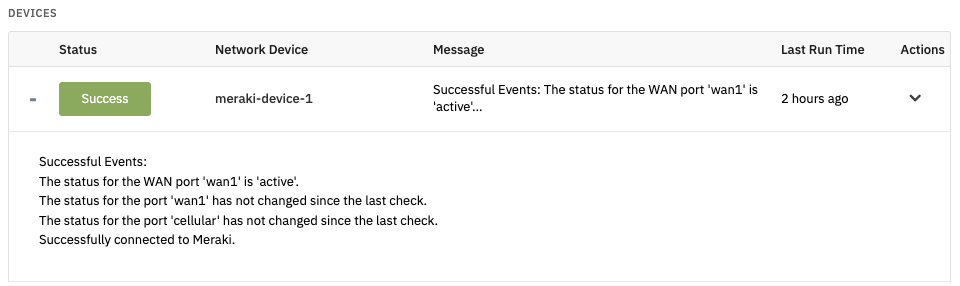
Meraki Router Uplink Event Monitor
The Meraki Router Uplink Event Monitor watches WAN and cellular ports on your Meraki routers and sends alerts about any interface status changes. You can configure the event monitor to alert only about interfaces that are down, to alert about any status change, or use both options to get a well-rounded view of conditions.
 Router Uplink Event Monitor Output
Meraki VPN Status Event Monitor
The Meraki VPN Status monitor watches Meraki "Router" devices. It can alert you if the status of any connected VPN link changes since the last time the event monitor ran. It also has an option to alert you if the link to any connected VPN goes down.
 Meraki VPN Status Event Monitor Output
More About FrameFlow's Cisco Meraki Monitors
For more detailed information about each of these event monitors, head over to our knowledge base. There, you can find technical articles that go over each setting offered by all of our event monitors, including protocols, authentication, use cases, and more.
Try FrameFlow for Free Today
If you're new to FrameFlow, why not take us for a spin? Download our fully-featured free trial and you'll be up and running in five minutes. Alongside our Meraki monitoring solutions, our entire catalogue of over 120 event monitors is included in the free trial.