First, download our free 30-day trial edition and run the setup. Or, if you're already a licensed customer, log into your account on our site and download the licensed version from there. You'll need a system or virtual machine running Windows Server 2012 or later. For evaluation purposes, a Windows 10 box will work fine too.
Set up takes about three minutes. There are no pre-requisites so just run the installer and it will create a brand new FrameFlow instance for you.
To view this tutorial in video format, visit our getting started video.

Next, enable login security to protect access to FrameFlow. FrameFlow has support for multiple users with different levels of authority. Administrators have full access to all parts of the FrameFlow interface. Managers have full access but cannot add, edit or delete other user accounts. There are also roles that provide view-only access or access to only dashboards and/or reports.

You can have FrameFlow manage the accounts or you can choose to use our Windows-integrated security option which authenticates using your domain credentials instead.
Now add one or more network devices. In this tutorial, we will add them manually. In other tutorials, we will show you how to scan an IP range or import devices from Active Directory.
Select the "Network Devices" option in the menu on the left. Then right-click on one of the device groups and choose "Add Network Devices...".

A window will appear where you can add the hostnames or IP addresses of the devices you want to monitor. To add multiple devices, separate them with commas. They will appear in the folder that you selected but you can use drag-and-drop to move them to another folder.
Now that you've added a device to FrameFlow, you can start to build your monitoring configuration. Select the "Event Monitors" section in the menu on the left. Then right-click on the "Default Group" folder and choose "Add Event Monitor".
An event monitor is a task that runs on a regular schedule and checks one or more devices.
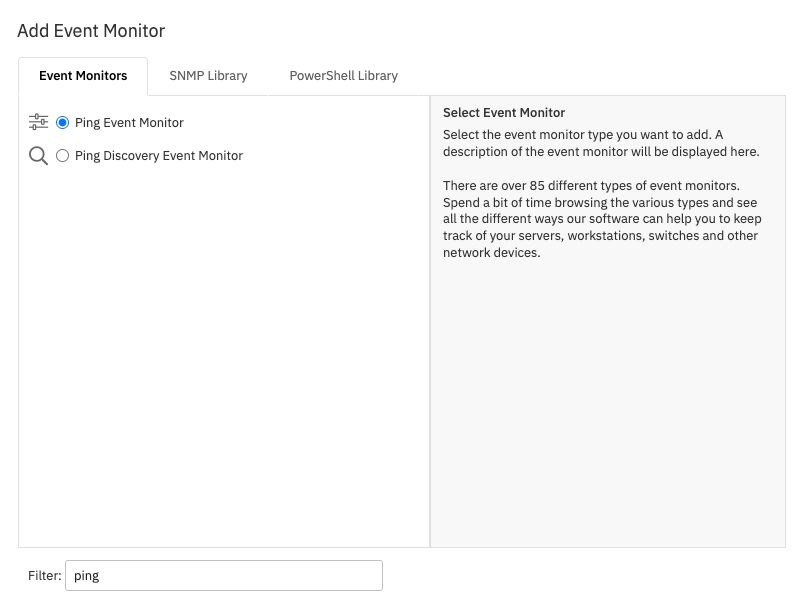
The window that appears will show the complete list of all available event monitor types. In the filter box, type "ping" and then select the "Ping Event Monitor".

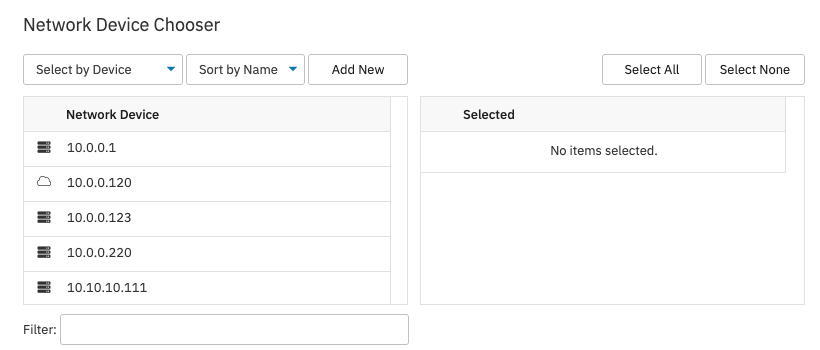
After selecting the event monitor, the settings for the event monitor will appear. In the "Network Devices" section use the "Chooser" button.

Select the devices that you want the event monitor to check. For now, select the device names individually. Later you might want to set the event monitor to monitor all devices in a particular group or all devices with a particular tag.

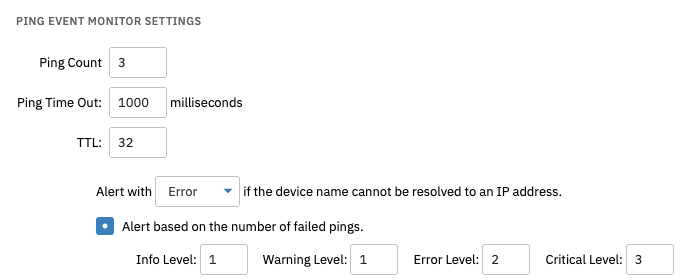
Next, select the settings and thresholds for the event monitor. Each event monitor type has its own unique set of settings. For example, the SQL Server event monitor lets you run SQL statements, the Window Service event monitor lets you select services, and the CPU usage event monitor lets you select CPU thresholds.
In this tutorial, we are using a Ping event monitor. It has options to control how many times it will ping each device and options to alert based on ping failures, average response time, and maximum response time.

Take a bit of time to review the available options and select the ones that best fit your environment and monitoring requirements.
When you have selected your preferred settings, skip over the other sections in the event monitor settings page. We'll cover them in other tutorials. Scroll to the bottom and use the "Save Changes" button to create the event monitor.
The event monitor will run once, right away, and then every 10 minutes after that. At any time you can go back to the event monitor's settings tab to change the schedule, the thresholds, or anything else.
Use the Actions menu to run the event monitor five or six times in a row. Each time the event monitor runs it produces a textual event describing the results and one or more data points that are used to build graphs.

Running it a few times in a row will generate enough data points to produce some nice graphs.
Go to the Status tab of your new event monitor to see the results of the last run. Depending on which options you selected and what the event monitor found when it ran, you will see an event with a status of success, info, warning, error, or critical.

Select the "Graphs" tab for your event monitor and select the option called "Multi Graph: Avg/Max Response Time".

That graph will show you the average and maximum ping response time that was detected each time the event monitor ran.

You've successfully added a network device, set up ping monitoring for it, and viewed the results. Your event monitor will continue to run and collect data.
FrameFlow is about more than just ping checks though. You can monitor databases, websites, switches, routers, printers, power equipment, and more. FrameFlow's goal is to give you a single-pane-of-glass view for all of your critical IT operations.
Spend a bit of time exploring the other event monitor types we offer. We have 100+ event monitor types and we are adding more all the time. Did you know you can even develop custom event monitors using PowerShell and other scripting languages? It's pretty cool, so check out our tutorial for that.
More IT Monitoring Features